Researcher
Summary
I have created a large Python stock analysis program over the summer of 2018. There are two parts to this program, collection and analysis. Before any analysis can be done, some data must be collected. In the collection section, a csv file of basic stock information is first downloaded from the official NASDAQ website. Then the file is parsed to get the list of 6000+ stock tickers along with their respective industry and sector. For every ticker, two pages are requested from Yahoo Finance and one API call is made to get the raw data. For maximum efficiency, the Yahoo Finance data scraping is multithreaded and multiprocessed. The raw data is then cleaned and used as measures or used to calculate some measures. Once all the collection has completed, the data is stored in a SQLite database.
The analysis section lets the user analyze the stock information. Before the analysis is done, the user can choose and edit multiple options on how to analyze the stock information. The user can choose the time, the group of stocks to analyze and how much strength each measure has on the final score of each stock. When the user is satisfied with the options given, analysis is done. First ranks are given to each measure compared with stocks with the same measure. Then, using the weightings and ranks of each measure, a score is produced for each stock. The higher the score, the better, and the more likely the user should buy the stock. Some basic statistics are also calculated. After the calculations are done, all the data is displayed in two tables. The Researcher repository is not publicly available because I fear Yahoo Finance may block any requests from the program, if the program were to be used by multiple people.
Purpose of Project
When the summer of 2018 started, I wanted use the computing science skills I recently learned at the U of A and develop them further. I also thought it would be a good idea to have a project to show off to recruiters. There were two reasons why I chose to develop Researcher and not something else. Firstly, I wanted to create a unique program that I didn't have access to without spending some cash. I also wanted to create something that could help me in some way. Researcher seemed like a perfect fit. It would help me with long term investments, and I could not find anything like it without spending money.
Definitions
- Stock: is all of the shares into which ownership of the corporation is divided.
- Ticker: Usually a 1-4 character long string that represents a company's stock.
- Collection session: The collection, formatting and storage of stock data from start to finish.
- Collection section: The GUI which lets the user manage a collection session.
- Stock Measures: Data that helps determine a stock's performance
- Analysis section: The GUI and windows which lets the user analyze stocks.
Features
There are two parts/sections to this program, collection and analysis. The collection section mainly involves the collection of all the stock data for the current day. The cool thing about the collection section is that it can either be run with a the GUI or on a terminal using the exact same lines of code. The analysis section uses the data collected and options given to it, by the user, to produce a score for all stocks on the chosen day.
Collection SectionBefore any analysis can be done, data must be collected. In order to start the collection session, the user must be on the page shown below. If the user has just started Researcher, this page will be the default page shown on startup. If the user is at the collection section of the window and there is no collection session running, the user navigates to this page by clicking the "collect" tab at the top left.
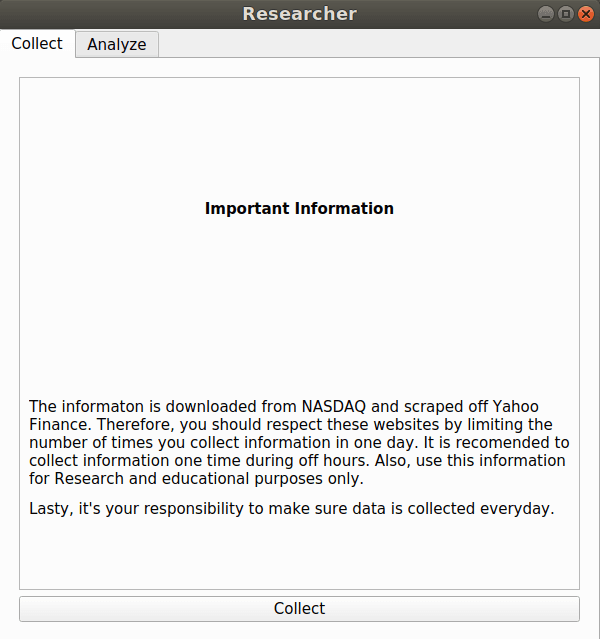
The user must press the "collect" button to start. This action moves the user to the collection progress page, displayed below, and starts the collection session.

The collection session first downloads and parses a csv file from the official NASDAQ website. The file contains a list of all public US stock tickers and the respective sector and industry the stock is considered to be in. Then it starts scraping 2 Yahoo Finance pages and makes one IEX API call for every ticker read from the csv file. The API call is used to get the stock's price history in order to calculate its RSI while the rest of the data is scraped off the Yahoo Finance pages. The Yahoo Finance/API collection process will take about 2 hours due to the reactive limiter I created for the collection session (More about why later). This entire process is multithreaded and multiprocessed to increase and/or maintain the speed. First, the main process creates a collection process. After the collection process has downloaded and parsed the csv file,it creates multiple threads for scraping. Every stock that has had all of its raw data collected is passed to a refinery process, which was initially created by the collection process. The refinery process cleans/formats the data, calculates some measures, and inserts the stock measures into the appropriate table in the database. The collection session can be cancelled any time, if the user presses the "stop" button or presses the close button at the top right. All the threads/processes can be stopped because I implemented a kill signal that all threads/processes listen for. Once the collection session is cancelled, all data created from this scraping season are also deleted, since it would be incomplete and would mess things up. The log, in the middle of the page, also has a couple of features. The main purpose of the log is to print out all successes and errors which you can scroll through. A feature of the log, is that it holds a maximum of 500 lines to maintain CPU performance. Since the log only holds 500 lines, all errors are also appended to an error text file to be read later. The log also keeps the scroll bar at the bottom, if the scroll bar has not been touched or the user has scrolled to the bottom. Moreover, the user can clear the log by pressing the “Clear Log” button. Lastly, once the collection session is done(ie. the progress bar at the top has reached 100%) or has been killed, the user presses the "finish" button to go back to the original page.
Analysis SectionIf at least one days worth of stock data is stored in the database, then analysis can be done. It should also be worth noting that analysis can be done while a collection session is active. If the user is in the collection section, he/she must press the "Analyze" tab at the top left to get a bunch of options shown below.

With "Get measures from" you can select any day stored in the database to analyze. The "Stock performance on" can be used to see the percent gain/loss the stock has achieved past the "Get measures from" date. The "Analyze" section gives the user a chance to analyze a certain sub group of stocks. Lastly the "Measure Strengths" section gives the user the power to select which measure will have the most impact on each stock's score. The down arrow means the lower the value the better and the up arrow is the opposite. These arrows can be switched by clicking them. The numbers beside the arrows is the percent strength of the measure. The measures should sum to a 100%, but it is not required. The NTS and NSS are measures that I have have developed myself. NTS stands for net transaction score, where it basically represents how many times insiders buy and sell shares of their company's stock. NSS stands for net share score, where it basically represents the total amount of shares bought and sold by insiders. Both scores make sure that stocks with lots of insider trading do not have an advantage/disadvantage compared to stocks with low amounts of insider trading. Here is how NTS is calculated.
Here is how NSS is calculated.
After the user has selected the options, the "Analyze" button should be pressed. This brings up a new a bigger window shown below.

There are two tables shown. The top table shows the basic statistics of the stocks being compared as a whole. The tables uses mean, Q1, median and Q3. The bottom table shows the main information the user is interested in. Each cell, in the main table, has a number contained within curly braces which shows the rank of the stock's specific measure compared with the other stocks with the same measure. The number to the right of the rank number is the actual value of the measure for the specific stock. For each stock, a score is produced with the ranking and strength of each measure. By default, the stocks are ordered by score, with the highest scoring stocks being placed at the top. With this score, the user can determine which stock to buy. The score formula is shown below.
Lastly the user can resize top table and bottom table by clicking and dragging the white line between the tables. If the line is dragged all the way to the top, the statistics table is hidden. If it is dragged all the way to the bottom, the main table is hidden. If the user clicks a measure’s title, x, the stocks will reorganize so that stocks with the highest ranks of measure x are displayed first. If the user clicks the measure x’s title again, stock ordering will be reversed. For example, in the below picture, I have hidden the statistic table and I have clicked the ROE column title once.

Technologies used
Python 3Python 3 was the only language I used to create this program. As usual, I did not have any difficulties using it.
PyQt5This was the library used to create the GUI. I mainly made the GUI in QT designer as I could create the interface very quickly. After I created the GUI in the QT designer, I used pytz to convert the QT designer files into messy python code. One thing I didn't like about this method was that it was hard to make minor changes to the interface and maintain the python GUI code. One minor problem I had with PyQt5 was that I felt some widgets were missing some necessary functionalities. However, it was easy to create sub classes that had these functionalities.
SQLite3All stock information are stored in a SQLite3 database. All stock information belonging to a certain business day are stored in one table named that day's date. So a new table is created every new business day, after that day's collection is complete. I felt this storage method was better than storing everything in one table or splitting the stock information into multiple measure tables. If everything was stored in one table, the table would gain 6000+ lines of stock data every business day. That means the search efficiency may slow down after a year of continuous use. If the stock information was split into multiple measure tables, it would just be like storing everything in one table, but doing it for 12 tables, which is even worse! This is because the program would always have to access every measure table to analyze the stocks. The one benefit of the measure splitting over day splitting would be that some storage efficiency could be achieved as duplicate values could be stored in a date range for some measures only. With the method I used, the system would only have to search through 261 tables after one year of continuous collection, and the search time within tables will always be constant and quick.
RequestsIt gets the HTML from Yahoo Finance to be parsed. I have had no problems with it.
Beautiful Soup 4The program uses Beautiful Soup to parse the HTML pages collected, and I felt it was very easy to use.
Complications and Lessons Learned
There were a couple of complications I faced. The first one was choosing the correct library for scraping the Yahoo Finance stock pages. When I first started, I chose the first library that could achieve my goal of stock collection without doing much research. The first library I used was Selenium. After I developed a scraping system with selenium, I noticed a big problem. It was way too slow! This was due to the fact Selenium would load the every web page on a chrome browser. With such limited speed I could only scrape a limited number of Yahoo Finance pages. Then I tried Scrapy. I learned my lesson with Selenium and I did research and a couple of simple tests to compare Scrapy's speed with Selenium. It was a lot faster. So much so, that I could collect all stock information within a reasonable amount of time. After developing a scraping system with Scrapy and merging it with the rest of my program, I learned I could not restart the collection session without restarting the program. This is because the library was using global variables that could not be reset for some reason. This was a big problem, as the user should be able to restart the collection session. It turned out that Scrapy was mainly built for web crawling(continuous use) and not web scraping. After doing lots of research and tests I finally started using the requests library which is still being used by my program today. I learned multiple lessons on how to pick the right library. First, you should check if the library is specifically built for what you need. Then you should check if the library is actively supported by a company or community; the key word is active. Next, you should check if the library is buggy by searching “library x is buggy” with Google. Lastly, do some tests to make sure it can meet your program requirements.
Another complication I faced, was optimizing the collection session. As mentioned above, the library effected how fast I could scrape Yahoo Finance pages. Even with the requests library, I still felt I could improve the speed. After doing some optimization tests, I realized I should multithread and multiprocess the collection session. I learned a lot about optimization, mulithreading and multiprocessing thanks to developing Researcher.
With such optimized scraping code, Yahoo Finance did not like how fast I was going. Like mentioned earlier, I did do some speed tests early on, and Yahoo Finance did not block me. However, after scraping a couple days worth of data, they started blocking me if I went to fast. So I created a reactive request limiter to meet their speed demands. Initially it took 20 minutes to scrape all the pages, but after Yahoo Finance wanted me to slow down, it scrapes everything in 2 hours now. So I learned that I should respect sites by limiting the requests made per minute.
Things that could be improved
I would probably try to fill the page where the user can start the collection, as it feels way too empty. Furthermore, I think more advanced statistic should be added to the top portion of the analysis window, like correlation. If the program was funded, I would probably only use a paid API for stock information.
FAQ
Why didn't you exclusively just use a free API?The limited free APIs I found, seemed incomplete and inaccurate. I trust Yahoo Finance data, and it has data such as insider trading, that free APIs do not have. I like Yahoo Finance so much, that I am willing to wait 2 hours for the scraping to complete. However, the IEX API I use to get price history of each stock seems to be improving monthly. If IEX improves enough, I might switch to it.
Does the program also work for OSX and Windows?Theoretically it should work for both of these operating systems, but I have not done the testing. The main problem might come from PtQt5 because visuals are OS dependent. Moreover, the multiple threads and processes used by the collection session might also be a problem, as each OS might handle them differently.
What is the scraping speed of this program?It was initially 20 minutes for a couple of days. However, Yahoo Finance did not like how fast It was going, and started blocking Researcher based off how fast it scraped the site. So now it takes 2 hours thanks to the reactive request limiter I made.
If Researcher was funded what would you change?I would only use a paid API for stock information. That would be the only feature that would need funding.
What does Yahoo Finance think of this program?I have never contacted them directly, but they don't seem to mind me scraping stock information from the site. They just don't want me to scrape the site too fast. If I released this publicly, it might be a different story though.